
Entity-Relationship (ER) Model
A basic and fundamental data modeling tool that describes the data and the connections between the data. The Entity-Relationship (ER) model invented by Peter Chen in 1976 is one of the vital structures in the area of database design because it explains the logical and physical conditions of the database before its implementation.
The primary purpose of the ER model is to provide a clear and logical data model for database design which is used to visualize data and effectively communicate with people. This is achieved by developing a single view of the data which is called an entity-relationship diagram (ERD), where each entity is depicted once and linked by the relationships.
The primary aim of ER Model is to visualize data which is used in a database which includes a set of formalism and concepts for correctly defining, storing, retrieving and transforming the data in a database. The concept of the ER model is to represent data physically and conceptually in the database. Certifiable label creates a cumulative reference to the corresponding certified attributes
1. Introduction to ER Model
An ER model is an extremely important asset when it comes to constructing databases that are efficient, flexible, and ready for complex relationships. ER Model is a cognitive vehicle for designing relational databases, which are the main data storage mechanisms for modern computer systems. An Entity-Relationship Diagram (ERD) is a visual illustration of the ER model, which portrays the entities in a system and their relationships with each other.
The paramount goal of the ER model is to draw a picture of the data and the business rules connected with it in an abstract manner. Through the utilization of this model, database designers can produce a high-level design that does not depend on the underlying physical storage devices.
This model is made up of the following components: entities, attributes, relationships, and constraints. The entities’ links play a dominant part in deciphering data interoperability, and at a practical level, they indicate a relational schema in a database.
2. Key Components of the ER Model
a. Entities
- Entities are the foundation and soul of the ER model.
- An entity stands for either an object or a concept of the system that is easily distinguishable from the others.
- In the main, the entities in such diagrams correspond to the real world entities, which are, in most cases, the object (or person), event or some other thing.
- Each of the entities in the ER diagram is represented as a rectangle.
Entities may be grouped into:
1.Strong Entities:
- These entities are independent of other entities and can be recognized on their own. They have a primary key which can be used for the charm of all entities involved.
- Example: A Student object can possess fields like its StudentID, Name, and DateOfBirth, where StudentID is the primary key.
2.Weak Entities:
- They are the entities the attributes of which by themselves do not suffice to identify a unique entity. Therefore, they have to relate to another entity (the “owner” or “strong” entity) to establish their identity. In the ER diagrams, they are represented by double rectangles.
- Example: A Dependent entity probably is associated with the Employee entity where the dependent can’t exist without the employee.
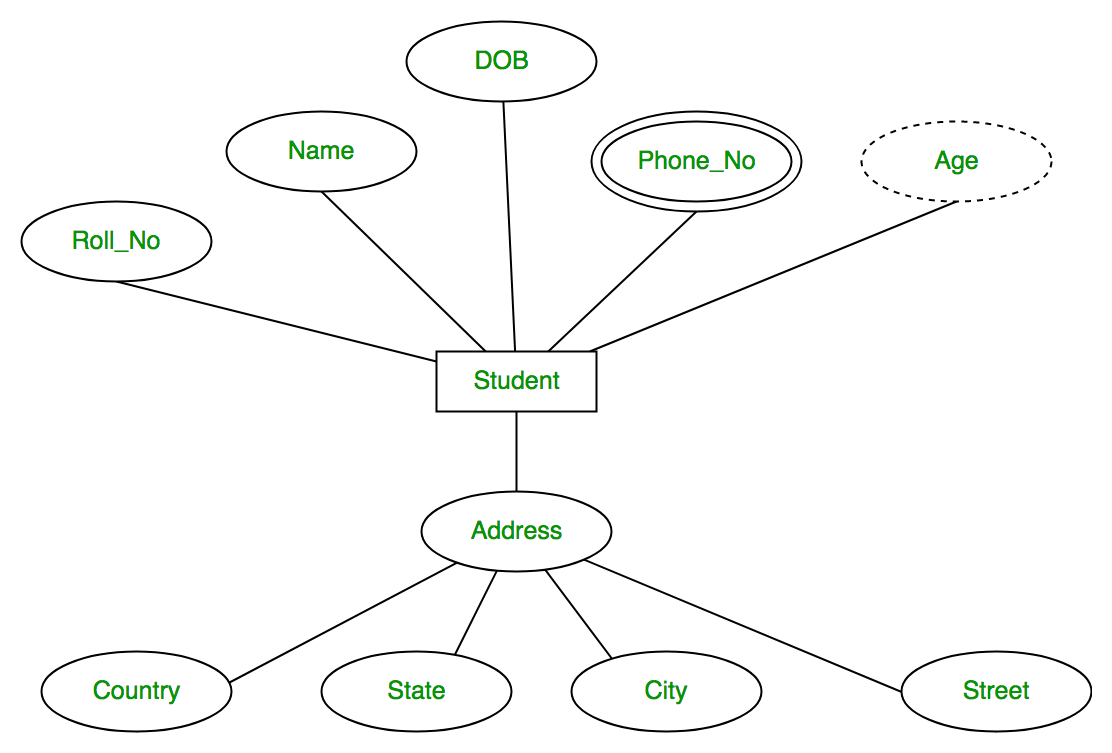
b. Attributes
Attributes are like the distinctive features or traits of entities. They are the one that shows up as cylindrical shape in ER diagrams. There are a different types of attributes:
1.Simple (Atomic) Attributes:
- These attributes are the ones which cannot be broken down into smaller parts.
- Example: Name, Email, Salary.
2.Composite Attributes:
- These attributes are the ones which can be divided into the sub-attributes.
- Example: Full Address might be a composite attribute that is split into Street, City, State, and Zip Code.
3.Multivalued Attributes:
- This kind of attribute can take more than one value for a single record.
- Example: A PhoneNumber attribute in a Customer entity, where a customer may have more than one phone number.
4.Derived Attributes:
- Attributes that are derived through the computation of other attributes.
- Example: Age, which can be derived from the DateOfBirth attribute.
c. Relationships
A relationship is an association between two or more entities. Relationships are diamonds in an ER diagram, connected by lines from one entity to the other. The relationships that appear here can be grouped into different types of relationships based on the number of entities they connect.

1.One-to-One (1:1) Relationships:
- This is where a particular object is related to only one object of another type.
- Example: A Person entity and a Passport entity. A person can have just one passport, and a passport can indicate only one person.
2.One-to-Many (1:N) Relationships:
- A single occurrence of an entity is many times involved with other other entities that are not the same, but each instance has only one link to the original one.
- Example: A Department entity and an Employee entity. A department can be responsible for many employees, each of whom works for only one department.
3.Many-to-Many (M:N) Relationships:
- Examples of one entity can be connected to examples of the other, and the two entities can be given independently. The relationship is commonly split into two one-to-many relationships, with the creation of a third table (commonly called a junction or bridge table).
- Example: A Student entity and a Course entity. A student can take many courses, and a course can have many students.
d. Primary Key and Foreign Key
- Primary Key (PK): The primary key is a unique identifier for each of the instances of an entity. Each and every item in the ER model should have a primary key. It is necessary because the latter is the only way that we can be sure that Create Thesis was developed.
- Foreign Key (FK): A foreign key is an attribute in one entity that references the primary key of another entity. It is a link between the two tables. Example: In the Employee table, the DepartmentID attribute can be a foreign key that is referencing the Department table’s DepartmentID primary key.
3. ER Diagrams Conventions and Notation
ER (Entity-Relationship) diagrams are popularized means to symbolically visual database structures. The following symbols usually occur in ER diagrams and are interpreted as follows:
- Entities: They are represented in a diagram as rectangles.
- Attributes: They are shown as ovals with composite attributes indicated as nested ones.
- Primary Keys: They are attributes with the underline beneath them.
- Relationships: Diamond.
- Foreign Keys: They are attributes that the entities use to connect.
- Weak Entities: They are depicted in a diagram as double rectangles.
4.Entity-Relationship (ER) Design Issues
- The database design phase requires that an entity-relationship (ER) design be specified for the database that defines the entities, relationships, and constraints that make up the system so that efficient maintenance and data integrity can be ensured.
- Because the ER model is a powerful instrument for structuring and visualizing the data, a number of challenges and design problems may emerge during the process.
- It is important to handle these issues in the design of a good database system which satisfies both functional and non-functional requirements.
- In this part, we shall try to review the key issues connected to ER design such as ambiguity, redundancy, cardinality constraints, weak entities, generalization and specialization, normalization, and handling many-to-many relationships.
- We shall further focus on the solutions for these issues, thereby ensuring the effective ER modeling.
1. Ambiguity in Entity and Relationship Identification
- One of the most frequent hitches in ER design is the problem of ambiguity in the identification of entities and relationships.
- The ambiguity develops mainly due to the fact that the designer at times is confronted with a situation where it is not easy to tell an entity from a relationship.
Issue:
- On certain occasions, an entity that at the first sight seems like it is an entity might turn out to be a relationship or vice versa. For example, the situations where “Employee” and “Department” look like two different entities but their relationship (i.e., “works in”) incorporates the idea of work within the business although work is not a separate entity could be one such case.
- Misinterpretation of business requirements or lack of communication with stakeholders can lead to the misinterpretation of the ER diagrams and thus to the confusion.
Solution:
- To solve this problem it is necessary to communicate with stakeholders until we completely understand the issue.
- Moreover, visualizing entities not as abstract concepts, but rather as distinguishable and self-contained objects is another aspect that is as important as the above case.
- A case might appear where it’s impossible to merge them into one entity if two objects are deeply related.
Example:
It is possible for a hospital database to treat a patient-doctor relationship as a “treats” relationship between Doctor and Patient entities, but the ambiguity might occur if we select “Doctor” as an entity which will then have a relationship with the “treats” relationship rather than being modeled as a time period or an activity.
2. Redundancy in ER Modeling
- Redundancy refers to the unnecessary repetition of data in the database.
- Enhanced Entity Relationship Modeling is a stage at which this matter is common, the relationships and attributes are modeled in a manner that creates an excessive repetition of data, therefore normal form is broken.
Issue:
- Redundancy of data occurs in the case of entities that share specific common attributes or relationships that cannot be abstracted ideally.
- In other words, two entities can have the same attribute, which leads to redundancy.
- For example, if the entity “Employee” named an employee with multiple attributes e.g., EmployeeAddress, EmployeePhoneNumber, the equal data is included in another entity, the duplication is possible and that can lead to the inconsistency of data.
Solution:
- Avoiding redundancy through normalization techniques is the way to go.
- This is achieved through normalization which is the ability to arrange the attributes and entities in the correct relations to make sure that no redundancy occurs in the database.
- The method of avoiding multiple attributes or relationships being recorded at the same time is by not writing the same thing twice.
- This not only ensures consistency but also decreases data storage overhead.
Example:
If a Student entity contains a field StudentAddress and a Course entity also possesses a field named CourseAddress, there could be the repetition of data on the places. This problem could be solved by introducing a new entity Address which consolidates the location.
3. Cardinality and Participation Constraints
- Cardinalities are the amounts of the nearest entities that can be joined to particular instances of another entity.
- Participation constraints specify whether or not each instance of an entity is compelled to join in a relationship.
Issue:
- Not realizing what the cardinality of the entities between them is the reason for the wrong relationships. Let us suppose that a Customer can place multiple Orders, but each Order can only belong to one Customer, therefore, a one-to-many relationship is the most suitable. However, incorrectly designing it as a one-to-one relationship would make the database incapable of handling numerous orders.
- Similarly, not attributing participation constraints with joining relationships to entities correctly (whether it is a must or a may decision) would make the data model be inconsistent.
Solution:
- It is necessary to take cardinality and participation constraints into account meticulously. For each relationship, establish whether it is one-to-one, one-to-many, or many-to-many sequences, and ensure that it is accurately depicted in the ER diagram.
- Moreover, to accomplish this, you can apply the correct symbols, for example, using solid lines for mandatory participation or dashed lines for optional participation, to indicate the proximity between the entities.
Example:
A Course entity might have a one-to-one relationship with a Student entity, thus a student can enroll in a maximum of one course and a course can have one student. This would lead to things where both get into the same table which is a many-to-many relation and a junction table is needed to tackle the issue.
4. Weak Entities:
- A weak entity is one that does not have the means to be uniquely identified through its own attributes and has to fall back on another entity (called the owner or strong entity) for identification.
- The double rectangles are used in ER modeling to depict weak entities.
Issue:
- Modeling weak entities means understanding the relationships between entities. A weak entity that needs to be bound to a strong entity should have a primary key, and thus its connections have to be in the right way.
- Dysfunctions are incurred if weak entities are not detailed correctly or they they are dependent on other entities to exist, which in consequence leads to the creation of wrong or redundant tables.
Solution:
- It is important to confirm that the relationship between the weak entity and strong entity is correctly represented (both quantitatively and descriptively) and also to confirm that the weak entity has a composite primary key that consists of the primary key of the strong entity.
Example:
For example a University database might Organization is a weak entity that is mainly a University entity. A Department has its attributes but it still would not exist without a University to which it is bound.